Using iplotx with cogent3#
iplotx is a library to visualise trees and networks using matplotlib (cogent3 uses plotly internally). It supports dozens of options to style the appearance of trees and can produce static images, interactive plots, animations, and so on.
Note
As iplotx is a separate project from cogent3, please post any issues or help requests on the iplotx forums.
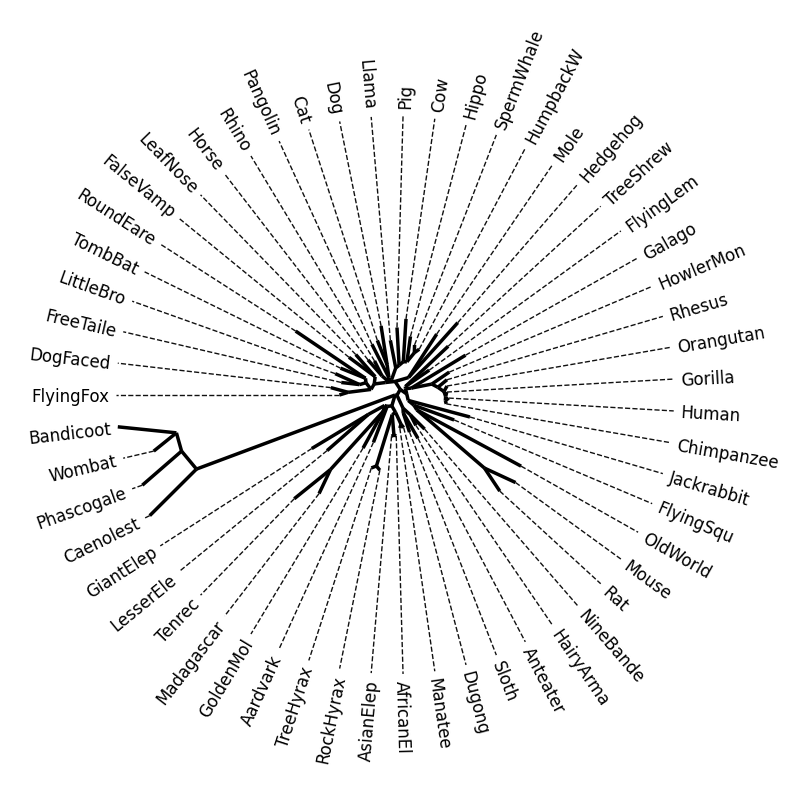
Below is a simple example on how to combine cogent3 with iplotx:
import cogent3
import iplotx as ipx

ens_tree = cogent3.load_tree("data/GN-tree.json")

tree_artist = ipx.tree(
  ens_tree,
  layout="radial",
  layout_angular=True,
  leaf_deep=True,
  leaf_labels=True,
  aspect=1.0,
  margins=0.1,
  figsize=(10, 10),
)
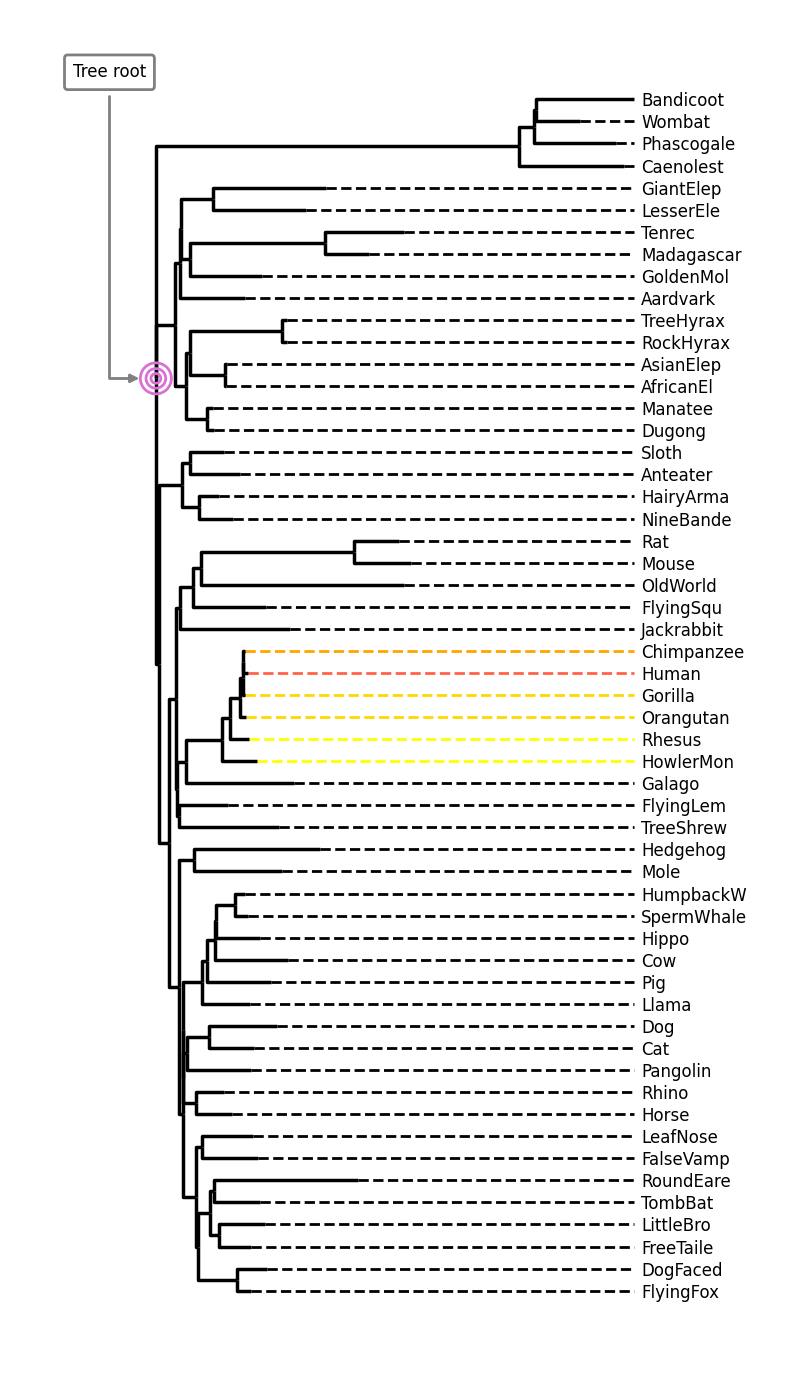
A taste of style options#
iplotx supports a large number of options to style the appearance of trees. As an example here, we choose a rectangular layout with non-angular branches, colouring some leaf edges for species related to humans. We can also build the matplotlib figure canvas manually, which is useful to combine trees with other types of graphical elements. We illustrate this by combining the tree plot with a matplotlib figure annotation and a scatter plot around the tree root.
from collections import defaultdict
import cogent3
import matplotlib.pyplot as plt
import iplotx as ipx

reader = cogent3.get_app("load_json")

ens_tree = reader("data/GN-tree.json")

# Customise the figure as you like
fig, ax = plt.subplots(figsize=(8, 14))

# Inject plot into the figure/axes
tree_artist = ipx.tree(
  ens_tree,
  layout="horizontal",
  ax=ax,
  leaf_labels=True,
  # Style options
  layout_angular=False,
  leaf_deep=True,
  margins=(0.2, 0),
  leafedge_color=defaultdict(lambda: "black", {
      "Human": "tomato",
      "Chimpanzee": "orange",
      "Orangutan": "gold",
      "Gorilla": "gold",
      "Rhesus": "yellow",
      "HowlerMon": "yellow",
  }),
  leafedge_linewidth=2,
)

# Add an annotation with an arrow towards the root
layout = tree_artist.get_layout().values
root_coords = layout[layout[:, 0] == 0][0]
ax.annotate(
    "Tree root",
    root_coords,
    (-0.1, 55),
    xycoords="data",
    textcoords="data",
    arrowprops=dict(
      color="grey",
      arrowstyle="-|>",
      shrinkA=4,
      shrinkB=12,
      linewidth=2,
      connectionstyle="angle",
    ),
    bbox=dict(
        boxstyle="round,rounding_size=0.2,pad=0.5",
        facecolor="white",
        edgecolor="grey",
        linewidth=2,
    ),
    fontsize=12,
)

# Also add concentric circles at the root
ax.scatter(
    [root_coords[0]] * 3,
    [root_coords[1]] * 3,
    s=[50, 200, 500],
    facecolor="none",
    edgecolor="orchid",
    linewidth=2,
)

# Ensure tight layout for minimal whitespace
fig.tight_layout()